Traffic safety officers are invited to register for a free training on Pedestrian Safety Education & Enforcement (PSEE) this summer.

![]()
![]()
![]()
![]()
![]()
![]()
![]()
![]()
![]()
![]()
![]()
![]()
Traffic safety officers are invited to register for a free training on Pedestrian Safety Education & Enforcement (PSEE) this summer.
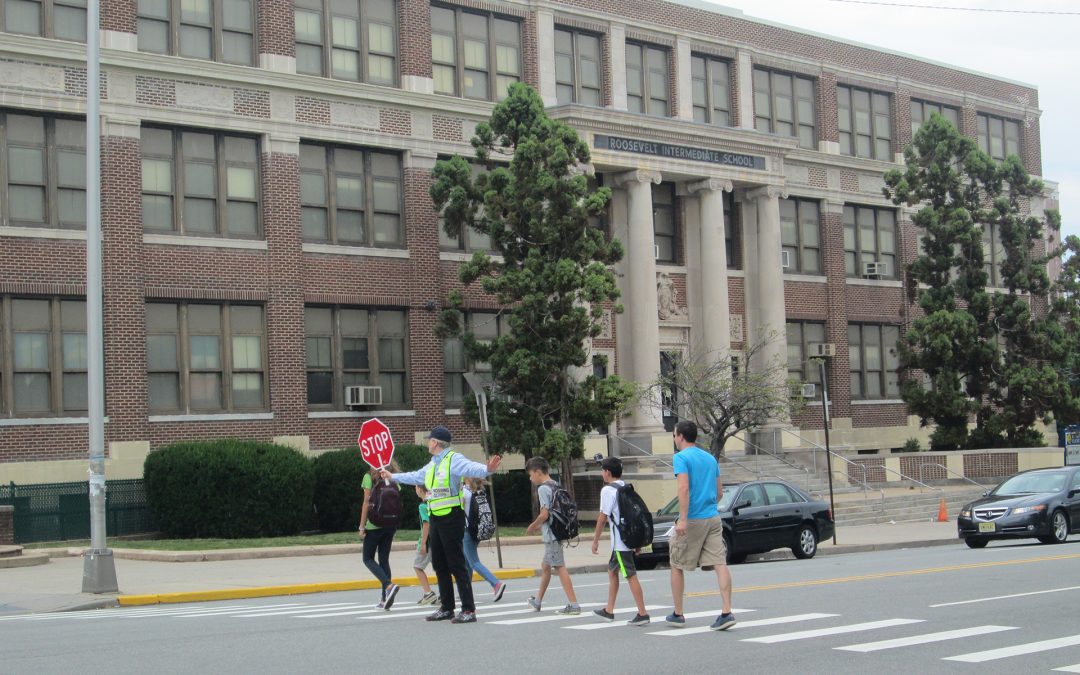
The death of a New Jersey crossing guard underscores the growing dangers they face from speeding and distracted drivers, highlighting broader concerns about traffic safety, accountability, and the need for systemic changes to protect those safeguarding children.

Watch VTC Executive Director Leigh Ann Von Hagen present “Getting There Matters: How Active Transportation Creates Connected Communities for Families” at a recent Lunch & Learn webinar with Advocates for Children of New Jersey.
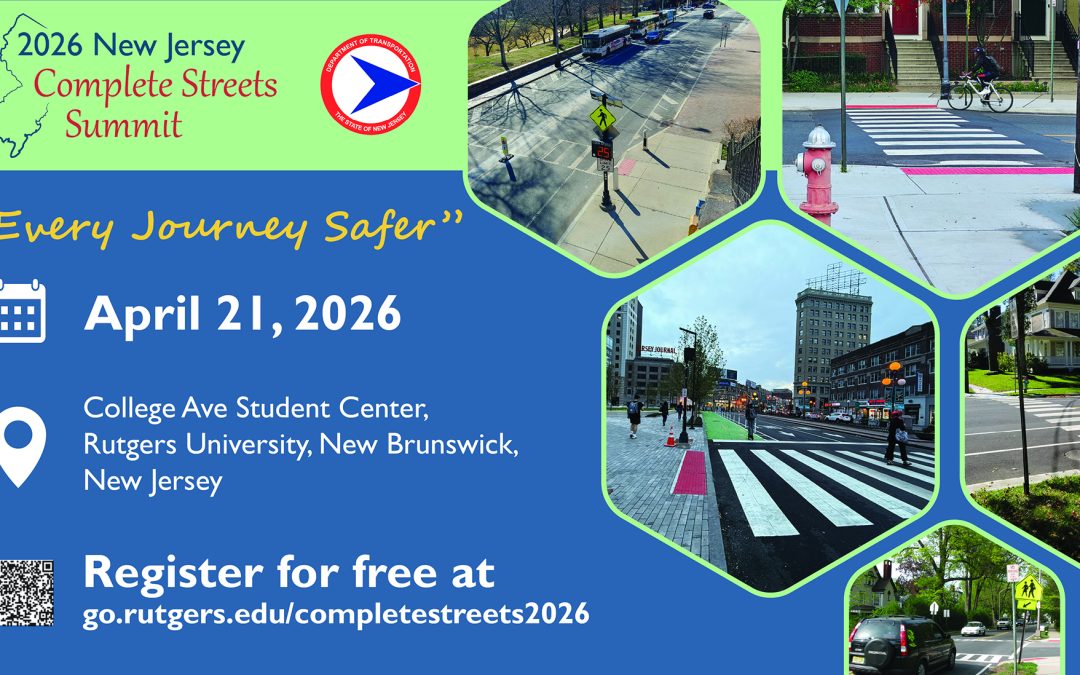
Registration is now open for the 2026 New Jersey Complete Streets Summit! Join the NJDOT and transportation leaders as we work toward making every journey safer across the state.

Convened by the Transportation Research Board (TRB), the 2026 TRB Annual Meeting was held January 11–15, 2026, in Washington, D.C., at the Walter E....

As e-bikes and other micromobility devices grow in popularity, it’s essential for young riders and their guardians to understand how to use them safely. These devices offer a fun, healthy, and eco-friendly alternative to driving. The following guidance can help families and communities stay safe while sharing the road.

Curious about how walking, biking, and micromobility are reshaping our streets and cities? Join us for a screening of the Association of Pedestrian & Bicycle Professionals’ Virtual Summit!

“This bill marks a crucial step in advancing awareness of New Jersey’s Safe Passing Law and, in particular, ensuring drivers fully understand their responsibility to protect pedestrians, bicyclists, and other vulnerable road users when they’re behind the wheel,” said Leigh Ann Von Hagen, AICP,PP, Executive Director, Voorhees Transportation Center.
More than 130,000 people die in road accidents in India every year — the highest in the world. Speeding, drunk driving and not using helmets and...
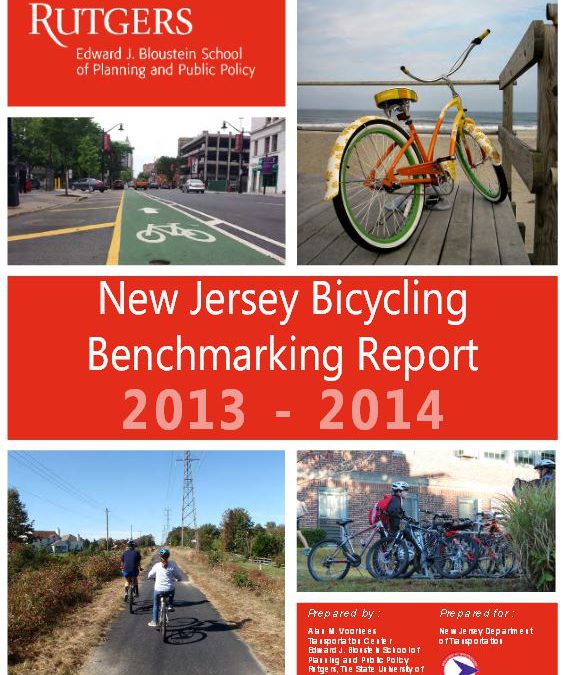
The report provides a comprehensive summary of the bicycle environment at the municipal level throughout the state, using extensive data from 60 municipalities as a baseline.
Transportation researchers rarely publish findings from qualitative methods in peer-reviewed transportation journals; quantitative methods dominate research in the field. In this article, we document the paucity of qualitative research in transportation journals and...
Virtual public involvement (VPI), defined by the Federal Highway Administration as “the use of digital technology to engage individuals or to visualize projects or plans,” is now an essential part of public participation in transportation planning and project...
We report on an analysis of carbon emissions from commuting to a large multi-campus university system, Rutgers, the State University of New Jersey. This is derived from a campus survey to assess carbon emissions and various attitudes towards sustainability across a...
Women and sexual and gender minorities (SGMs) have unique transportation experiences and needs, including public transit services. However, there is a gap in the data that documents their experiences and needs. This paper aims to add to existing research by examining...