


More than 130,000 people die in road accidents in India every year — the highest in the world. Speeding, drunk driving and not using helmets and...
Active Transportation
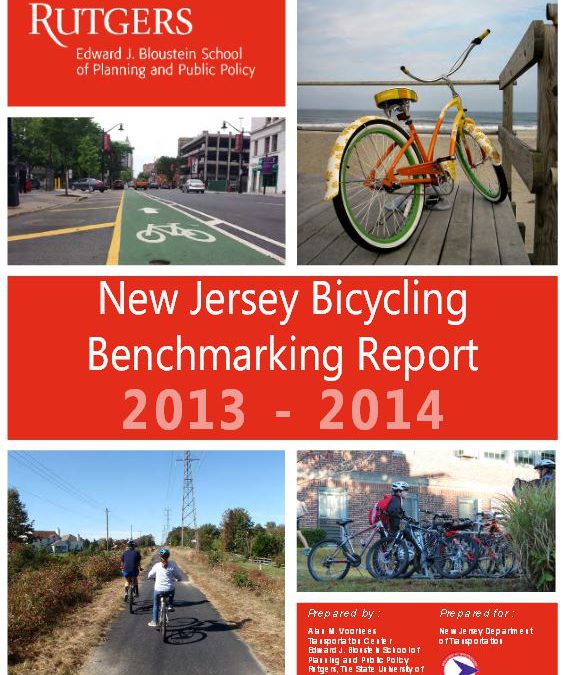
What are the 10 Best Towns to Ride Bikes in NJ? Check out the NJ Bike Ped Resource Center Bicycling Benchmarking Report
The report provides a comprehensive summary of the bicycle environment at the municipal level throughout the state, using extensive data from 60 municipalities as a baseline.
2011 Pedestrian Safety Tracking Report (2012)
This report is intended to extend and update the information provided in the 2010 Pedestrian Safety Tracking Report. Data presented in this report...
Coordinating School and Public Transportation
As tax relief and aid diminish each year while transportation costs rise, New Jersey school districts are under increasing pressure to consolidate,...
More Than Crossing Streets
Research on the state of the school crossing guard training and working conditions in New Jersey led to the development of current best practices in...
Confronting School Bus Cuts
School districts throughout New Jersey are forced to make budget cuts, and transportation particularly courtesy busing or non state-mandated busing,...
The 3’ Law: Lessons Learned from a National Analysis of State Policies and Interviews (2012)
Due to the significant number of bicyclist fatalities and injuries that occur as a result of accidents with motorists, bicyclists in many states,...
Can I Bicycle to School?
School policies play an important role in determining how students get to and from school each day. However, information on the consistency and...
Pedestrian Safe Corridors Memorandum (2011)
This memorandum contains a brief analysis of the pedestrian crashes pre- and post-improvement along three corridors in New Jersey: downtown Newark...
Bicycle Activity and Attitudes Survey Summary report (2011)
The Bicycle Activity and Attitudes Survey was a random-digit dialing anonymous telephone survey of households in the state of New Jersey, conducted...
Recent Publications
From Challenge to Resilience: The Evolution of NJ TRANSIT Funding and a Roadmap to a Reliable Future
Since its creation in 1979, NJ TRANSIT has grown into the geographically largest public transit system in the United States. Over more than four decades, the agency’s financial structure has shifted in response to changing state and federal priorities—shaping service...
Public Transit User Experiences and Feelings of Safety among Marginalized Genders
Harassment, discrimination, and violence are major concerns for women and sexual and gender minorities (SGMs) who ride public transit. However, these experiences often go underreported, and agencies may not be aware of the extent of harassment within their services....
Crash Data Availability and Best Practices Across the U.S.: Lessons for New Jersey
Objective While fatal crashes are available through the Fatality Analysis Reporting System (FARS) and are readily available to the public, many states do not make their crash data easily accessible for the public and the research community. The public has an interest...
Understanding How Marginalized Genders Travel Using NJ TRANSIT
Through this research, NJ TRANSIT sought to understand how women and members of the lesbian, gay, bisexual, transgender, queer plus community, sometimes referred to as sexual and gender minorities (SGMs) travel on NJ TRANSIT so the agency can provide better...