Principal Investigators: Robert Noland, PhD; Hannah Younes, PhD While fatal crashes are available through the Fatality Analysis Reporting System...
![]()
![]()
![]()
![]()
![]()
![]()
![]()
![]()
![]()
![]()
![]()
![]()
Principal Investigators: Robert Noland, PhD; Hannah Younes, PhD While fatal crashes are available through the Fatality Analysis Reporting System...
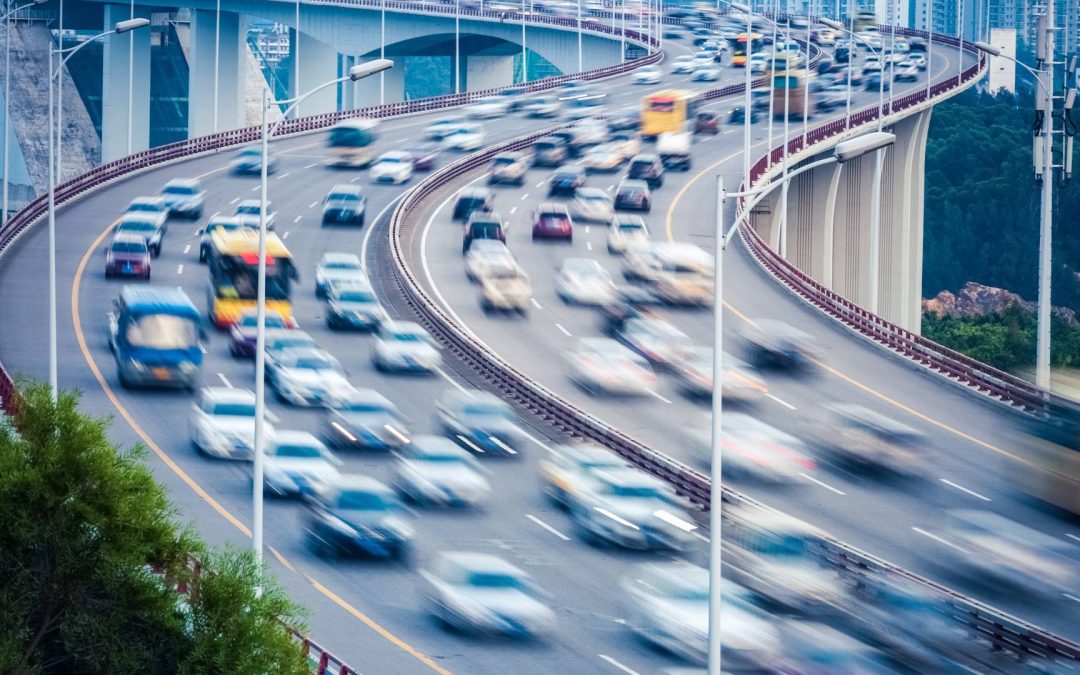
This project will help to address the need for information on induced demand by developing and piloting a guide that provides a framework for State DOTs to consider induced demand effects in various applications of transportation policy development, planning, and project development.

This is a multi-disciplinary effort to develop a database using a variety of mobility datasets. VTC’s role will be to assess the usability of this system, MobilityNet, as a useful tool for transportation planners.
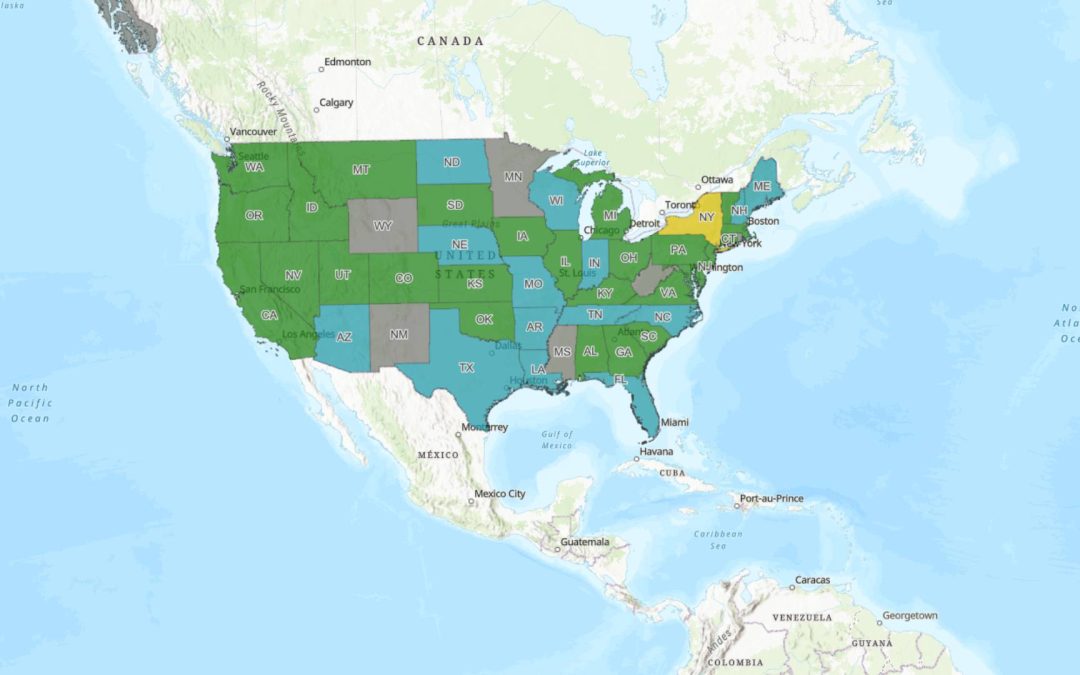
The New Jersey Induced Travel Calculator was developed to allow users to estimate how much new traffic is generated when a new road or new lane is built.
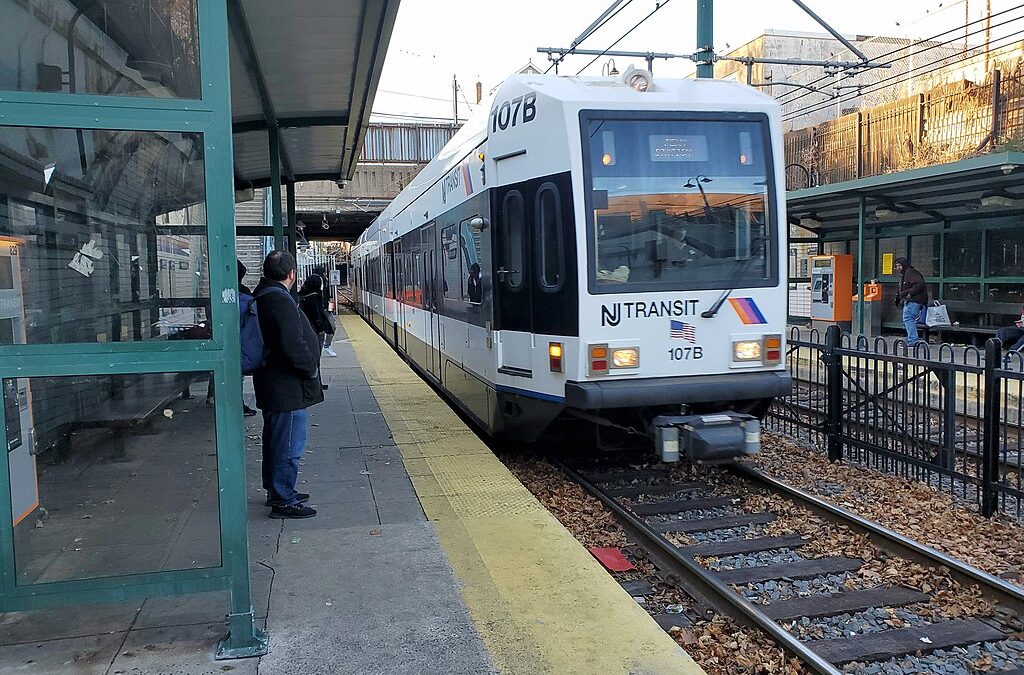
Specifically, we will seek to understand whether automobile drivers exiting from I-280 (at exit 13) can transfer to the NRL at the Orange Street NRL station (or other locations).
We are now collecting an additional round of data on the impact the COVID-19 pandemic has had on how people work, travel, and engage in commerce, to track these changes over time with the aim to determine whether these changes persist.

The objective of this project is to use methods, create tools, and test the tools in the service of the needs of real communities in order to explicitly integrate both the social and technology solutions to improve safety.
Transportation researchers rarely publish findings from qualitative methods in peer-reviewed transportation journals; quantitative methods dominate research in the field. In this article, we document the paucity of qualitative research in transportation journals and...
Virtual public involvement (VPI), defined by the Federal Highway Administration as “the use of digital technology to engage individuals or to visualize projects or plans,” is now an essential part of public participation in transportation planning and project...
We report on an analysis of carbon emissions from commuting to a large multi-campus university system, Rutgers, the State University of New Jersey. This is derived from a campus survey to assess carbon emissions and various attitudes towards sustainability across a...
Women and sexual and gender minorities (SGMs) have unique transportation experiences and needs, including public transit services. However, there is a gap in the data that documents their experiences and needs. This paper aims to add to existing research by examining...